
In this 10 MW Maharashtra solar plant, harmonics and DC injection passed, but short-term flicker reached Pst 9.33 against a limit of 1.0. India had 150.26 GW of installed solar capacity at 31 March 2026, according to MNRE, and Maharashtra had about 19.4 GW as of February 2026. Under CEA’s grid connectivity standards, inverter-based plants must measure harmonics, DC injection and flicker at least once a year, with DC injection capped at 0.5% of rated output.
At an assumed 20% capacity utilisation and ₹3 per kWh, a 10 MW plant earns about ₹5.3 crore a year, so every 1% of output lost to curtailment or a connectivity dispute costs about ₹5.3 lakh (illustrative figures).
Elion recorded seven days of data at the grid connection point with a Fluke 1777 analyser. Voltage THD peaked at 4.04%, current distortion at 2.81% and DC injection at 0.003%, all inside the limits used in the report. The flicker results (Pst 9.33, Plt 4.08) were far outside them. The report does not identify a cause, and this case study explains the method, the limits used, why a THD pass alone proves little, and the sensible next steps for the plant operator and the grid operator.
A solar plant power quality test measures voltage and current harmonics, flicker (Pst, Plt) and DC injection at the grid connection point, usually over seven days. CEA connectivity standards cap DC injection at 0.5% of rated output and require annual measurement. This 10 MW plant passed harmonics but showed Pst 9.33 against 1.0.
Why do solar power plants need harmonic and flicker testing?
Grid-connected solar power plants use power electronic inverters to convert DC electricity from solar photovoltaic modules into AC electricity for grid export.
These inverter-based generating systems can interact with the electrical network and influence power quality characteristics, including harmonic distortion, voltage fluctuations and flicker.
For grid-connected solar generating stations, power quality assessments are important for evaluating conformity with applicable grid connectivity requirements and the technical conditions specified by the relevant grid operator.
The principal areas considered in the assessment included:
- Voltage Total Harmonic Distortion (THD-V).
- Individual voltage harmonic distortion.
- Current harmonics and Total Demand Distortion (TDD).
- Short-term voltage flicker (Pst).
- Long-term voltage flicker (Plt).
- DC current injection at the grid connection point.
Monitoring these parameters helps plant operators identify power quality deviations, examine their possible causes and determine whether corrective measures or further investigation are required.
What did the 10 MW solar plant test set out to measure?
The assessment was undertaken to:
- Measure voltage and current harmonic distortion associated with the grid-connected solar generating installation.
- Evaluate harmonic characteristics using the specified statistical measurement intervals.
- Assess total and individual harmonic distortion against the limits adopted for the study.
- Measure short-term and long-term voltage flicker.
- Evaluate DC current injection at different solar generation levels.
- Document the measurement results for the plant operator’s power quality and grid connectivity assessment requirements.
- Identify parameters exceeding the applicable evaluation criteria.
Which CEA, IEEE and IEC standards apply?
The study considered the following regulatory and technical references:
CEA Technical Standards for Connectivity to the Grid
The Central Electricity Authority’s grid connectivity framework includes power quality requirements for generating stations, including inverter-based renewable energy installations. The relevant provisions and amendments must be considered alongside the plant’s connectivity conditions and grid operator requirements.
IEEE 519 – Harmonic Control in Electric Power Systems
IEEE 519 provides a framework for evaluating voltage and current harmonic distortion at the Point of Common Coupling (PCC).
IEC 61000 Series – Power Quality and Flicker
Relevant IEC 61000 standards provide measurement practices and criteria associated with power quality and voltage flicker.
The precise evaluation limits and measurement requirements depend on the applicable regulatory provisions, connection characteristics and requirements of the relevant SLDC, RLDC, CTU or other grid operator.
What exactly was measured at the grid connection point?
Elion assessed voltage Total Harmonic Distortion and individual harmonic components.
The assessment included:
- Daily 99th percentile of very-short-time, 3-second measurements.
- Weekly 95th percentile of short-time, 10-minute measurements.
- Individual harmonic distortion across the recorded harmonic orders.
- Comparison with the evaluation limits adopted for the project.
Current harmonic distortion was evaluated using the recorded harmonic components and the statistical assessment methodology documented in the report.
The analysis covered very-short-time and short-time current distortion measurements, including Total Demand Distortion and individual harmonic components.
Flicker Measurement
Short-term and long-term voltage flicker were assessed using Pst and Plt indicators.
Flicker measurement is important because voltage fluctuations may occur due to changes in generation, network conditions or interactions between the generating station and the grid.
DC Current Injection Testing
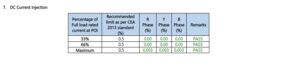
DC current injection was evaluated at different solar generation levels, including:
- Approximately 33% of maximum generation.
- Approximately 66% of maximum generation.
- Maximum generation condition.
The assessment compared the recorded DC injection values against the specified project evaluation limit.
How was the seven-day power quality test carried out?
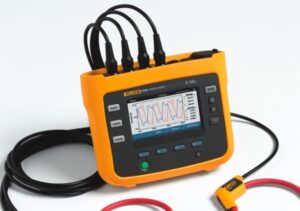
The power quality assessment was performed using a Fluke 1777 Three-Phase Power Quality Analyzer.
The instrument was connected to the current transformer (CT) and potential transformer (PT) secondary circuits associated with the grid control measurement arrangement.
Before recording measurements, the engineering team verified the phase sequence, polarity and connections and configured the instrument using the applicable CT/PT ratios, nominal voltage, frequency and wiring arrangement.
The analyzer continuously recorded electrical power quality parameters over seven days without interrupting normal plant operation.
After the monitoring period, the recorded data were downloaded and evaluated using Fluke Power Analyze software.
The assessment included harmonic distortion calculations, individual harmonic evaluation, statistical aggregation and comparison of the measured values against the report’s adopted limits.
What did the test find?
Finding 1: Voltage Harmonic Distortion Was Within the Adopted Limits
The seven-day assessment showed that the reported voltage harmonic distortion remained within the evaluation limits applied in the project report.
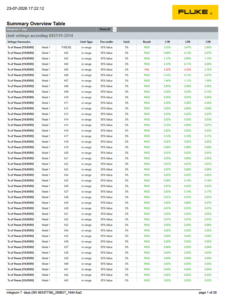
For the daily 99th percentile of 3-second measurements, the highest reported voltage THD was 4.04%, against the adopted limit of 7.5%.
For the weekly 95th percentile of 10-minute measurements, the highest reported voltage THD was 3.55%, against the adopted limit of 5%.
The report classified these results as satisfactory.
Finding 2: Current Harmonic Distortion Was Within the Adopted Limits
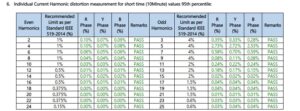
The current harmonic assessment included short-time and very-short-time measurements across all three phases.
For the weekly 95th percentile of 10-minute current distortion measurements, the maximum reported value was 2.81%, against the adopted limit of 5%.
The report classified the measured current distortion parameters as within the limits used for the assessment.
Finding 3: Elevated Short-Term and Long-Term Flicker Were Identified
Although the harmonic distortion results were within the adopted evaluation limits, the flicker assessment identified significant deviations.
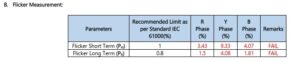
The maximum reported short-term flicker (Pst) value was 9.33, against the adopted limit of 1.0.
The maximum reported long-term flicker (Plt) value was 4.08, against the adopted limit of 0.8.
Both flicker parameters were classified as exceeding the limits used in the project report.
These results highlight the importance of including flicker analysis alongside conventional harmonic distortion testing.
The measurement results establish that elevated flicker was recorded during the monitoring period. However, additional investigation would be required to determine the underlying cause and establish whether the variations originated within the generating station, the external network or an interaction between them.
Finding 4: DC Current Injection Was Within the Adopted Limit
DC current injection was evaluated at multiple solar generation levels.
The maximum reported injection was 0.003% of the relevant rated-current basis, compared with the project limit of 0.5%.
The measured DC injection values were therefore classified as satisfactory in the project report.
Why does a THD pass not prove good power quality?
A key lesson from this assignment was that acceptable harmonic distortion does not automatically indicate that all power quality parameters are satisfactory.
The plant demonstrated voltage and current harmonic distortion levels within the limits adopted for the study. However, the elevated flicker measurements highlighted a separate power quality concern requiring technical attention.
For solar plant operators, this distinction is important because different power quality phenomena require different measurement methods and engineering investigations.
A complete assessment should therefore not be restricted to a single THD reading or a short-duration instrument measurement.
What should the plant do about elevated flicker?
Where elevated flicker is identified, the following engineering actions may be considered based on the site configuration and further investigation:
- Examine time-correlated solar generation, voltage and flicker trends.
- Review inverter operating characteristics and relevant control settings.
- Evaluate voltage variations at the grid interconnection point.
- Review reactive power control and voltage regulation behaviour.
- Coordinate with the relevant grid operator to examine upstream network influences.
- Undertake additional monitoring or corrective-action verification where necessary.
These are potential follow-up actions; the supplied project report does not establish a definitive root cause or document completed corrective measures.
What was the outcome of the project?
Elion completed seven days of power quality monitoring and prepared a technical measurement report covering voltage harmonics, current harmonics, flicker and DC current injection.
The assessment demonstrated that the harmonic distortion and DC injection parameters were within the adopted project limits, while identifying elevated short-term and long-term flicker.
The findings provided the plant operator with recorded technical evidence to support further power quality review and coordination under the applicable grid connectivity framework.
What power quality testing does Elion offer for solar plants?
Elion Technologies & Consulting Private Limited provides independent electrical engineering testing and assessment services for industrial installations, power infrastructure and renewable energy facilities across India.
Its relevant services include:
- Solar power plant harmonic analysis.
- Seven-day power quality monitoring.
- Voltage and current harmonic distortion assessment.
- Harmonic current injection testing.
- DC current injection measurement.
- Short-term and long-term flicker measurement.
- PCC and POI power quality assessment.
- Technical reporting with reference to applicable CEA, IEEE and IEC requirements.
Elion uses professional power quality measurement instruments and engineering evaluation methods to support project-specific testing requirements.
Frequently Asked Questions
Q1. Is harmonic analysis required for solar power plants under CEA regulations?
Yes. CEA’s Technical Standards for Connectivity to the Grid require inverter-based generating stations to keep harmonic current injection within IEEE 519 limits, DC injection at or below 0.5% of rated output and flicker within IEC 61000 limits, and to measure all three at least once a year in the presence of the parties concerned. CEA has also issued a draft 2026 revision, so check the connection agreement and the current notified text.
Q2. How many days are required for solar power plant harmonic testing?
This project used seven days of continuous monitoring, which allows daily and weekly statistical values to be calculated, and IEEE 519 practice recommends at least seven days for a harmonic assessment. The duration your grid operator accepts can differ, so confirm the required period with your SLDC or the connection agreement before the test.
Q3. What is the difference between harmonic analysis and flicker testing?
Harmonic analysis examines distortion of the voltage and current waveform at multiples of 50 Hz and is reported as THD, TDD and individual harmonics. Flicker testing examines slower voltage fluctuations using Pst over 10 minutes and Plt over two hours. A plant can pass harmonics and still show high flicker, as this 10 MW case showed.
Q4. Where is harmonic testing performed at a solar power plant?
Measurements are taken at the designated connection assessment point, normally the point of interconnection or point of common coupling, through the CT and PT secondaries of the metering arrangement. Establish the exact point from the single-line diagram and the grid connection agreement, and record CT/PT ratios before recording starts.
Q5. What does solar power plant power quality testing cost, and is it worth it?
The fee depends on plant capacity, number of connection points, monitoring days, travel and report scope, so testing firms quote after a scoping call. Compare it with the revenue at risk: at an assumed 20% capacity utilisation and ₹3 per kWh, a 10 MW plant earns about ₹5.3 crore a year, so each 1% of output lost to curtailment or a dispute is about ₹5.3 lakh (illustrative).
Q6. What should a plant do if flicker exceeds the limit?
First check that the data is valid: CT/PT settings, event flags and the percentile basis used by the standard. Then line up flicker with generation, cloud events, switching and grid disturbances, review inverter control and reactive power settings, check the grid strength at the connection point, and involve the grid operator. Retest after any change to confirm the fix.
Elion Technologies & Consulting Private Limited
Website: www.elion.co.in
Email: [email protected]
Phone: +91 9013890526
Request a quotation for Solar Power Plant Harmonic Analysis, Flicker Measurement and DC Injection Testing.